Executive Summary
This Executive Summary presents a comprehensive summary for the carbon footprint of the Darla Moore School of Business (DMSB). The objective of the Project was to quantify, evaluate, visualize, and baseline greenhouse gas, GHG, emissions associated with DMSB’s operations, including direct emissions from internal activities and indirect emission for the 2024 fiscal year, July 1, 2023, to June 30, 2024. Throughout the Project, the collaboration between CarbonCents and DMSB aimed to identify key emission areas, evaluate data collection methods, and lay the groundwork for future sustainability projects. All values reported below are in Metric Tons of Carbon Dioxide Equivalent (MTCDE). Further details regarding all emission activities can be found in the full Report.
Key Metrics

For the reporting year of 2024, DMSB’s emissions are 2,980.33 MTCDE. Scope 1 and Scope 2 emissions were measured in full, providing a comprehensive assessment of direct and indirect, electricity use, emissions. Scope 2 emissions represent the largest contribution to total emissions, reflecting the reliance on purchased electricity. Scope 3 emissions were partially assessed, covering waste emissions alone.
Scope 2 emissions are the largest contributor to the overall carbon footprint, comprised of purchased electricity, for general building electricity usage, and chilled water seen below.
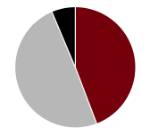
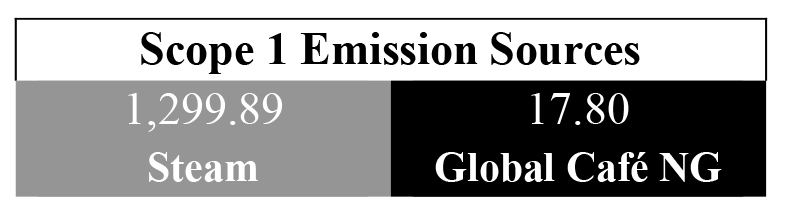
Scope 1 direct emissions for DMSB are exclusively from stationary fuels, with steam-based emissions being the largest single source for the footprint. Scope 3 emissions were assessed based on available data, focusing solely on waste, including landfilled municipal solid waste, recycling, and composting.
After the completion of the Carbon Footprint Report, areas of improvement and efficiency have been identified. Any further questions regarding the carbon footprint should be answered in the completed Report.

Reports and Data
Contact us if you need assistance accessing this material.